SIP rolling returns are the returns of a monthly SIP measured from every possible start date in a period, not just from one date. Instead of asking “what did a 5-year SIP started in April 2020 earn?”, you ask “what did every 5-year SIP started in any month between 2011 and 2021 earn?”.
The difference is large. A ₹10,000 monthly SIP started in April 2020 caught the bottom of a crash and looked brilliant. The same SIP started in January 2008 spent four years underwater.
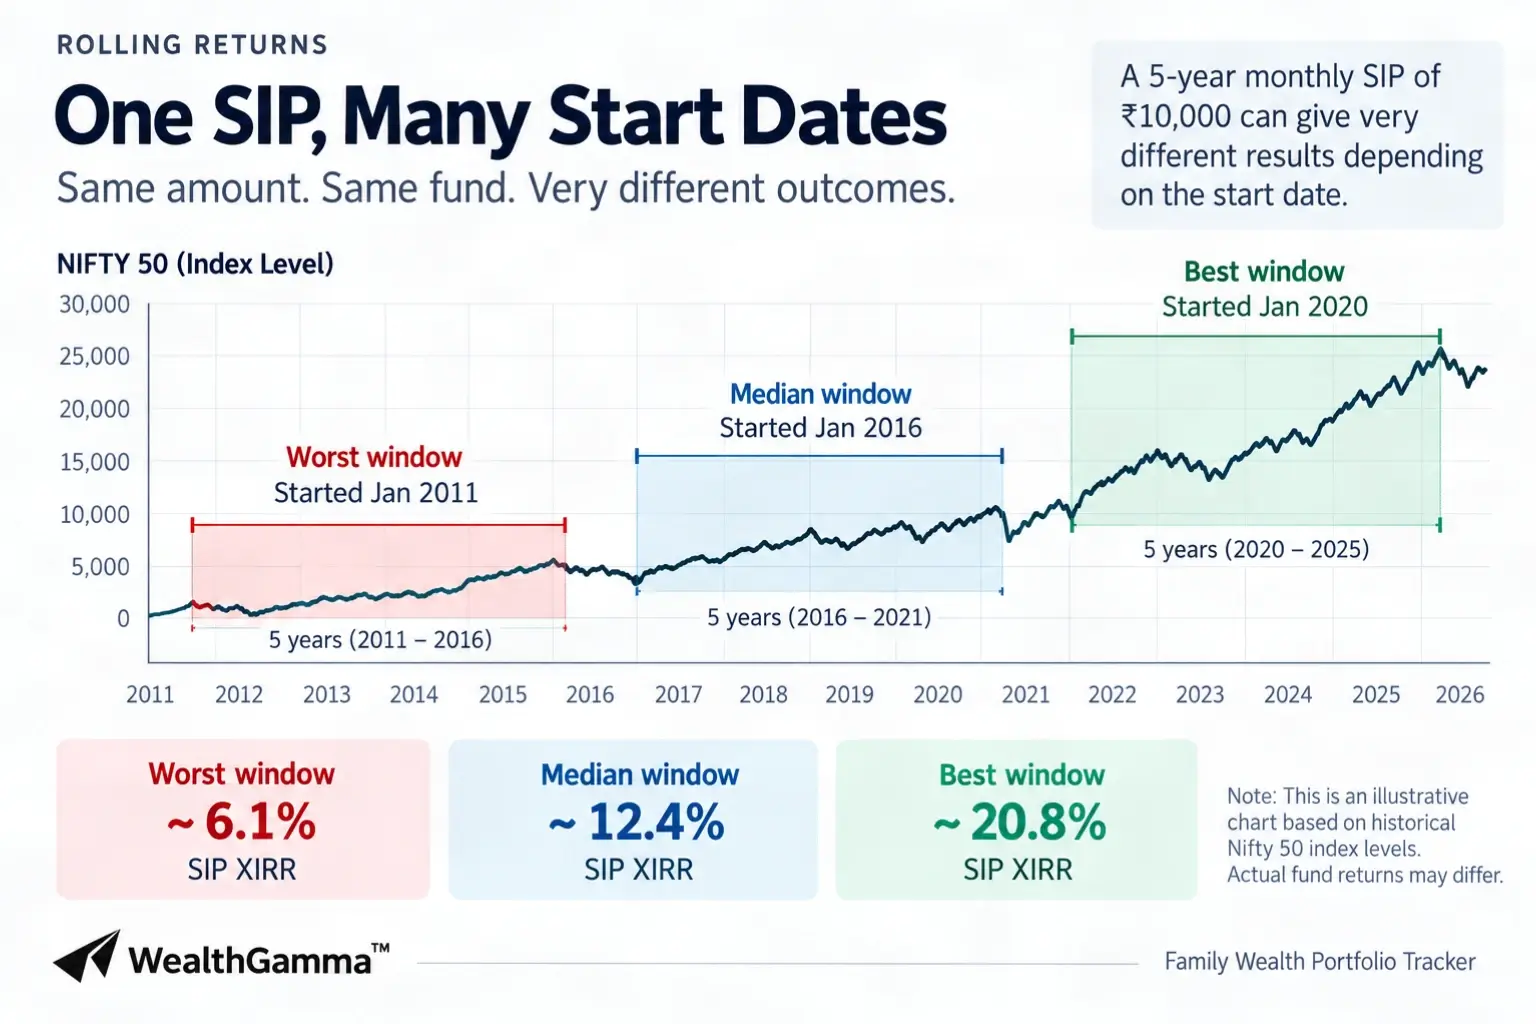
One number flatters and the other frightens. Neither describes the fund. Rolling returns give you the whole distribution: the best window, the worst window, the median, and how often the fund cleared a target you actually care about.
How do rolling returns work?
Rolling returns take a fixed holding period, say 5 years, and slide it across history one month at a time. A fund with 15 years of history gives you about 121 overlapping 5-year windows. Each window has its own return, and the set of them is the answer.
Point-to-point returns use one window. Rolling returns use all of them.
Say you want 5-year SIP rolling returns on a fund with NAV history from 2011 to 2026. The first window runs Jan 2011 to Dec 2015. The second runs Feb 2011 to Jan 2016. You keep sliding until the last full window ends at the most recent published NAV.
Each window is a full SIP: 60 monthly instalments, 60 different NAVs, one XIRR. Rolling returns don’t tell you what the fund earned. They tell you what its investors earned, spread across all of them.
Why does the start date matter so much for a SIP?
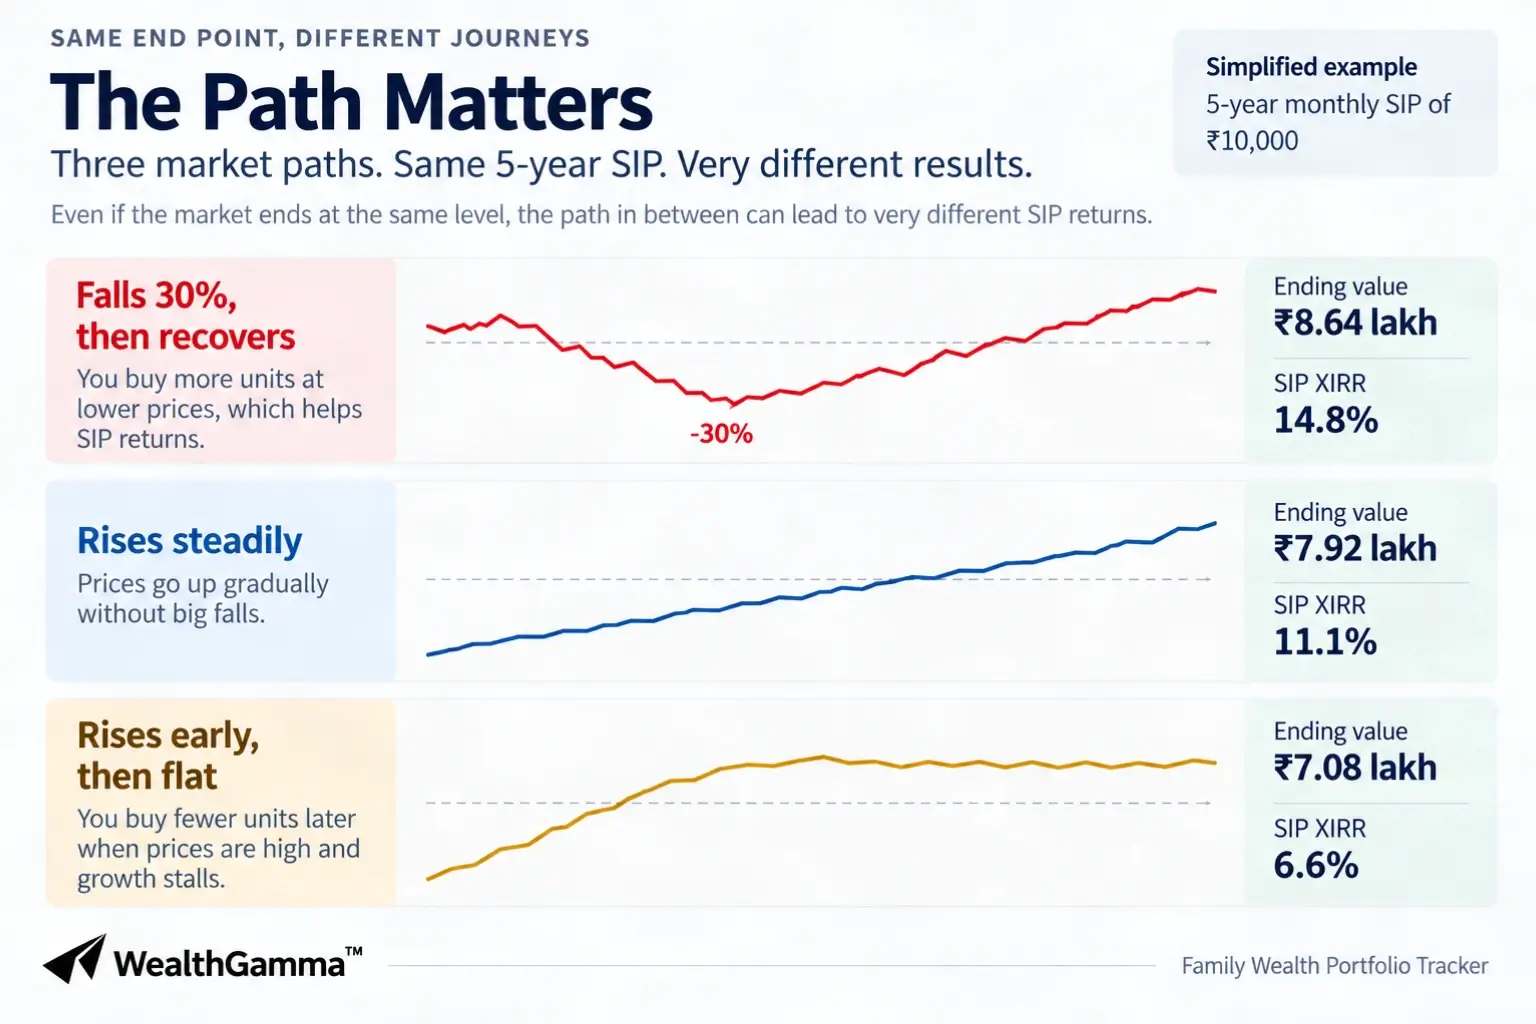
A SIP’s return depends on the shape of the market, not just its average level. You buy more units when NAVs are low, so a period that falls first and recovers later produces a higher SIP XIRR than one that rises first and flattens, even when both start and end at the same index level.
This is the part that surprises people. Two investors, same fund, same ₹10,000 a month, same 5 years, can end with very different money.
Consider a simplified 5-year SIP of ₹10,000 a month, ₹6,00,000 invested in total:
| Path the market took | Ending value | SIP XIRR |
|---|---|---|
| Falls 30%, then recovers | ₹8,64,000 | 14.8% |
| Rises steadily throughout | ₹7,92,000 | 11.1% |
| Rises early, flat for 3 years | ₹7,08,000 | 6.6% |
All three end at roughly the same index level. The order of the returns changed the outcome by more than eight percentage points.
A lump sum would not care about the order. A SIP cares enormously, because each instalment buys at a different price.
How do you calculate SIP rolling returns?
You compute one XIRR per window. For a 5-year window, lay out 60 outflows of the instalment amount on their actual dates, then one inflow on the end date equal to the units accumulated multiplied by the closing NAV. XIRR on those 61 cash flows is that window’s return.
Here is one window, worked with round numbers.
Step 1: Lay out the instalments. ₹10,000 on the 5th of each month, 60 times, from 1 April 2019 to 1 March 2024. Total invested ₹6,00,000.
Step 2: Convert each instalment to units. At an average purchase NAV of ₹42.80 across the 60 dates, you accumulate about 14,019 units.
Step 3: Value the units at the end. Closing NAV of ₹61.60 on 31 March 2024 gives ₹8,63,570.
Step 4: Run XIRR on the 61 cash flows. Sixty outflows of ₹10,000, one inflow of ₹8,63,570. That returns roughly 14.6% a year.
Step 5: Slide the window. Repeat for a start of 1 May 2019, then 1 June 2019, and so on. With NAV history to 2026, you get over 100 windows.
Then you summarise the set, not the individual numbers.
| Statistic on 5-year windows | What it tells you |
|---|---|
| Minimum | The worst run any investor had |
| 25th percentile | A realistic bad case |
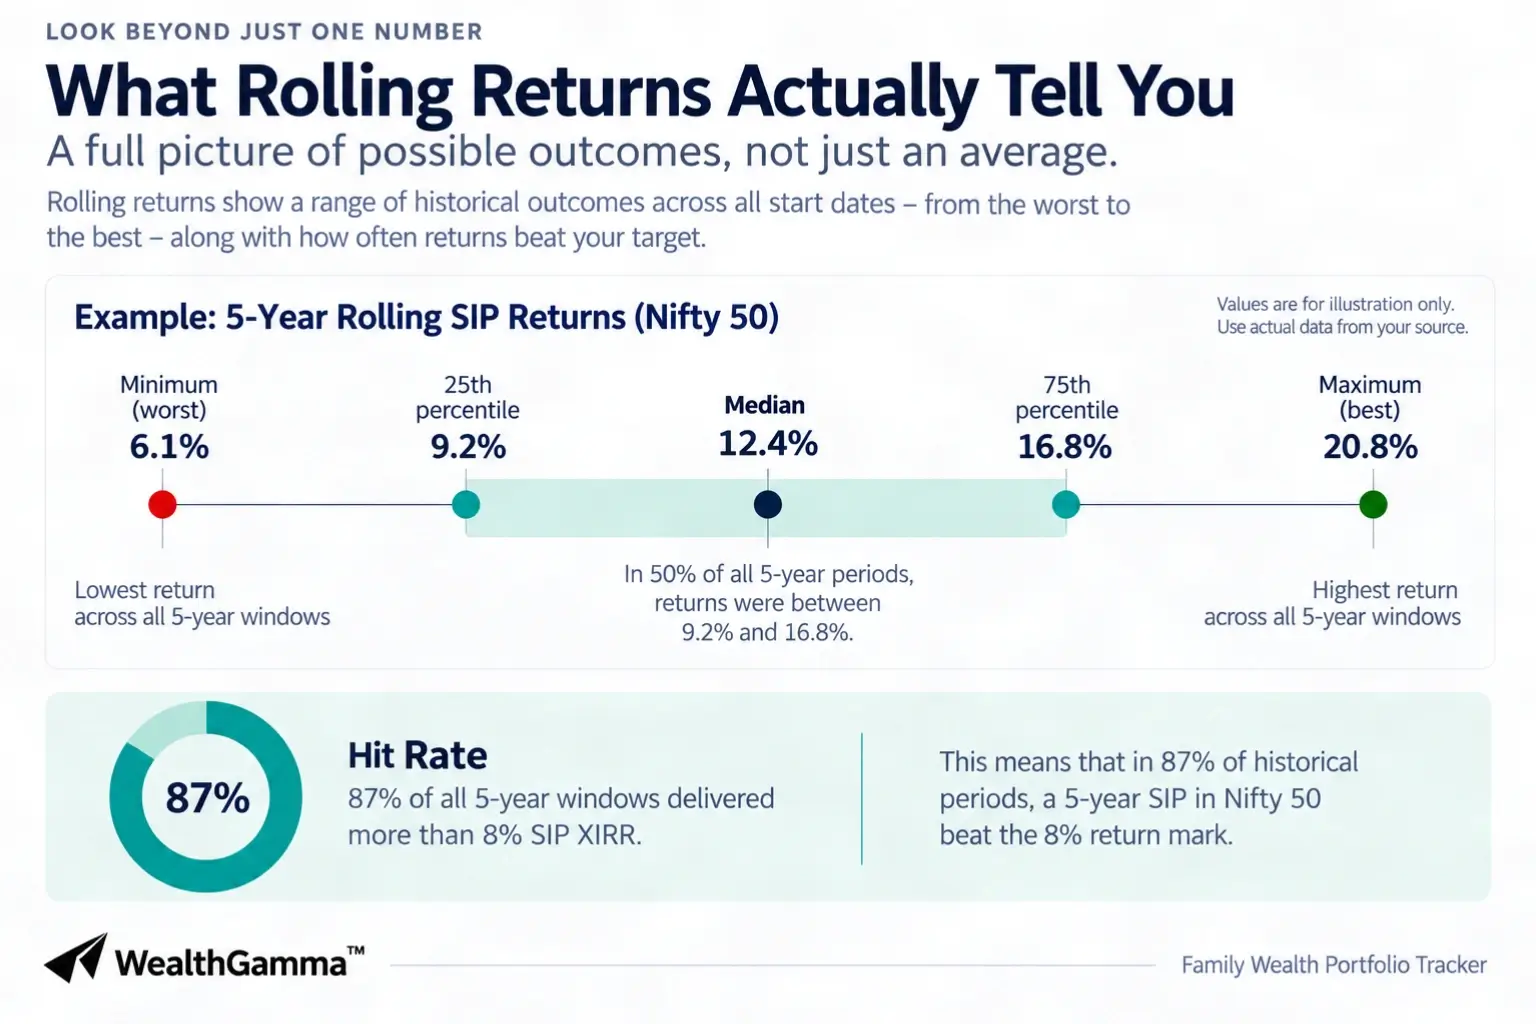
| Median | The typical experience |
| Maximum | The number the brochure quotes |
| % of windows above 12% | How often the fund met a common target |
Rolling returns are not a forecast. They are a record of how wide the outcomes were.
What counts as a good rolling return record?
A good record is judged on three things together: a median that beats the benchmark, a minimum that you could have sat through, and a high share of windows clearing your target. A fund with a 16% median and a negative minimum is a worse holding than one with a 14% median and a 4% floor.
Three tests worth running on any fund you hold:
- The floor: what the worst window returned. If it was 2%, ask whether you would have stayed invested.
- The spread: the gap between the 10th and 90th percentile. A wide spread means timing luck drove the outcome more than the manager did.
- The hit rate: the share of windows above your planning assumption. If you model 12% and only 45% of windows cleared it, your plan is optimistic.
Also check the window length against your goal. A 3-year rolling set for a retirement corpus 22 years away is the wrong lens. Use 10-year or 15-year windows if the history exists.
Where do rolling returns mislead you?
Rolling returns describe one fund’s realised past under one set of market conditions. Overlapping windows share most of their data, so the numbers look more independent than they are. A fund with 10 years of history gives you 61 five-year windows, but really only two non-overlapping ones.
Four limits worth holding in mind:
- Survivorship: merged and closed schemes vanish from the data, so surviving funds look better as a group than the category actually was.
- Overlap: consecutive windows share 59 of their 60 instalments. A single great year lifts dozens of windows at once.
- Regime: Indian equity history since 2003 includes long bull runs that may not repeat.
- Your own behaviour: rolling returns assume you never stopped the SIP. Most investors do, exactly when the window was about to turn.
Rolling returns don’t remove uncertainty. They show you the size of it before you commit money.
How do rolling returns fit into your own plan?
Use rolling returns to set the return assumption in your plan, then test the plan against the worst window rather than the median. If your goal still works at the 10th percentile outcome, the goal holds up. If it only works at the median, it is a wish with a spreadsheet attached.
That is the practical handover. Rolling returns tell you the plausible range for a fund. Your projection tells you what that range does to your corpus, your goal dates and your withdrawals.
A worked link between the two: if 5-year rolling XIRR on a large-cap fund ranged from 6.6% to 18.2% with a 12.4% median, model your retirement corpus at 12.4%, then re-run it at 6.6% and see what breaks. Usually it is the goal year, not the goal amount.
In WealthGamma, you can project a SIP’s future value at an assumption you choose, then run the same plan through 1,000 Monte Carlo runs to see the spread rather than a single line.
Frequently asked questions
Are rolling returns better than CAGR?
For judging consistency, yes. CAGR gives one start-to-end number. Rolling returns give hundreds, exposing the worst stretch that a single CAGR figure hides.
What window length should I use?
Match it to your holding period. Use 5-year windows for goals 5 to 10 years out, and 10-year or 15-year windows for retirement, if the history exists.
Do rolling returns predict future returns?
No. They describe the range of past outcomes across start dates. Use them to size uncertainty and stress-test a plan, never as a forecast.
How many windows do I need for the numbers to mean anything?
At least 36 monthly windows, which needs history of your window length plus three years. Fewer than that and one market phase dominates every result.
Is SIP rolling return the same as XIRR?
XIRR is the method used to compute each window. A rolling return set is many XIRRs, one per start date, summarised as a range rather than a single figure.
Where can I get reliable NAV history?
AMFI publishes daily NAV data for every Indian scheme. Scheme disclosures are filed with SEBI, and index history comes from NSE.
WealthGamma is a tracking and calculation tool, not a SEBI-registered investment adviser. Nothing here is investment or tax advice. Tax rules change, verify current provisions with the Income Tax Department or a qualified professional before acting.